Automotive  maintenance service
Helping customers track their vehicle's maintenance history

Project Overview
In today’s fast-paced world, industries are under pressure to keep up with the latest trends and technologies. One industry that is feeling this pressure is the automotive industry.
With the rapid advancement of new car models, consumers are increasingly demanding a better experience when it comes to repairing and maintaining their vehicles and parts procurement.
In order to meet these demands, automotive companies must constantly Innovate and improve their processes. However, this can be difficult to do without first understanding the needs and behaviours of consumers.
Through UX research methods, I was able to understand the needs of car owners and how to improve the experience of repairing and maintaining cars. Then used the research results to improve other aspects of the automotive maintenance journey, such as customer service and parts procurement.
My role
I led this project and was supported by a team of 3, comprised of a UI Designer, a Developer, and a PM. I was the sole individual responsible for User Experience and the deliverables of its artefacts.
I saw the project from the kickoff meeting to research, wireframes, customer journey map, and user flow and through multiple rounds of iteration afterwards.
Client:
HHA Mazda
Role:
UX/UI
Team:
Brackets Technology
Date:
2019

Project scope
HHA Mazda wanted to provide their customers with a better experience when it comes to repairing and maintaining their cars. In order for me to better understand their problems, I needed to analyse the market, customers and their behaviour, to find valuable insights that could help me discover those problems and solve them.
Exploring the problem
I conducted stakeholder interviews with the majority of the HHA team. I spoke with individuals from marketing, infrastructure, design, and engineering/development. These were the insights that we gleaned from those interviews:
- One of the biggest problems is that customers are not satisfied with the current options for repairing and maintaining their cars. They find the process to be time-consuming, expensive, and stressful.
- Another problem is that there is a lack of transparency when it comes to pricing, which makes it difficult for customers to know how much they should expect to pay for a repair or maintenance service.
- Finally, many customers feel that they are not given enough information about the repair or maintenance process, which makes them feel lost and confused.
RESEARCH
RESEARCH
RESEARCH
RESEARCH
RESEARCH

Research and Discovery
Because I was unfamiliar with the repair and maintenance industry, I began with benchmark research. in order to obtain helpful insights that might assist me in identifying problems and determining ways to solve them.
Vehicles market in Saudi Arabic
The number of registered cars in Saudi Arabia has increased rapidly in recent years. Between 2013 and 2016, the average price of petrol fell by around 30%, while the cost of taxi fares rose by around 20%. This encouraged more people to own and use cars and boosted demand for maintenance and repair services.
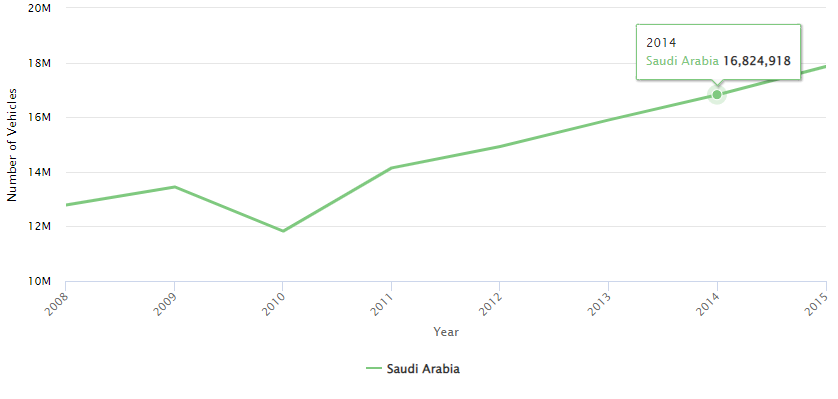
As a result, the number of registered cars in Saudi Arabia increased from 14 million in 2011 to 17.8 million in 2015. And Mazda share exceeded 2% for the first time in 2015, hitting a record in 2019 with 6.7% of the market share.
The average age of licensed cars was 7.4 years at the end of 2017. This figure reflects the conditions of a car. And we can assume regularity and high frequency of car maintenance.
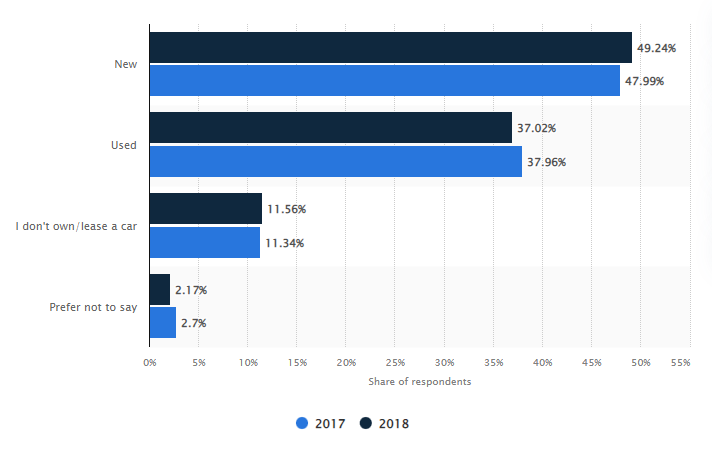
If you own/lease a car(s), did you buy them new or used?
Understanding the competitors' booking Process
Furthermore, I needed to better understand the booking process on the competitors’ websites. There are several steps involved.
In general, the automated procedure terminates at this point. After completing the booking, the customer will receive a phone call to confirm the appointment and discuss the specifics.
Competitive Analysis
The technique is insufficient for obtaining a complete picture of the market. As a result, we must compare the competitors and what they each have to offer. So I ran a competitive study to identify which features competitors valued the most.
To summarize the market research, I highlighted the most intriguing insights from my perspective.
User Research
Once the market overview was completed, user research can begin in earnest. It’s important to understand who the typical user of car maintenance is, what their level of expertise is, and when/where they are most likely to need the service. Additionally, it’s crucial to understand how users describe car issues and what type of service they need. With this information in hand, it will be much easier to find a solution that meets users’ needs.
Cars became a practical mode of transportation. Fuel cost reductions and the streamlining of the automobile driving procedure boosted automotive accessibility. Almost everyone can afford a car. This indicates that the number of people who don’t know how to repair their automobile has grown.
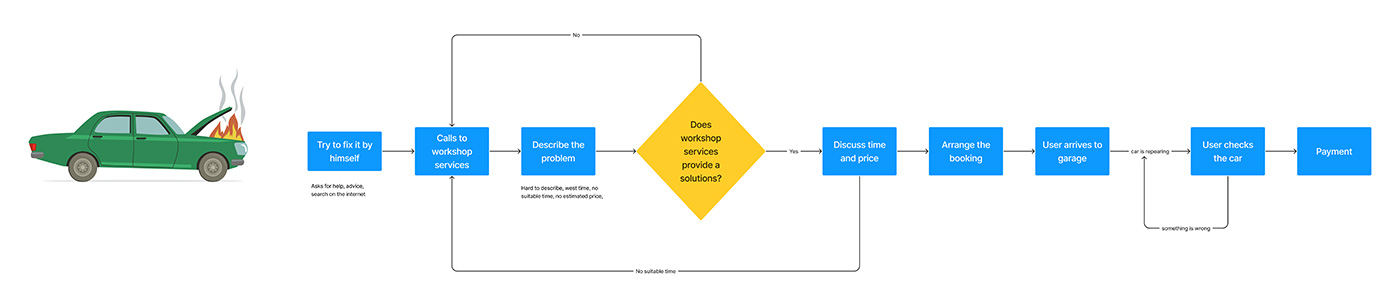
Of course, everything begins before you engage with a vehicle service provider. I worked out the sequence of buyer steps after a brief interview. All responders were split into two groups:
- One group will attempt to discover what happened to their automobile and repair it on their own.
- The second group consists of inexperienced users who have no idea what happened and will not be able to fix it on their own.
With this information, we may proceed to the following stage. Consider the most challenging circumstance, that of a non-proficient user.
Interviews
To gain some perspective on how car maintenance is managed by service providers, I conducted face-to-face interviews with six maintenance workers to assess their needs. I recorded and documented the interview process, allowing me to review and take notes later.
The recruitment criteria for the interviewees were:
- Have worked in car maintenance services for the last 12 months.
- Have access to an internet-enabled phone or device.
Objectives of the interview
- To understand how car maintenance services are managed.
- To understand the problems that the car maintenance provider faced in general.
- To evaluate the current existing mechanisms for resolving the identified problems.
I used a semi-structured interview guide to ensure that all participants were asked the same core questions while also allowing them to share their own experiences and perspectives.
The data were analyzed using thematic analysis. The findings suggest that there are several challenges facing car maintenance providers, including a lack of standardization, insufficient training, and a lack of transparency around pricing. However, there are also some promising practices, such as customer feedback mechanisms and increased use of technology, which can help to resolve these challenges.
Surveys
The survey was used as a research method to ascertain if there is a large potential market for a mobile application. The survey was conducted online with the target audience being car owners aged between 18 to 65 years.
The survey questions were translated to Arabic to ensure that all participants had a chance to choose their preferred language and, were delivered through Survey Monkey.
A total of 1,000 responses were received, out of which 860 were usable. Over 60% of the respondents aged between 18 and 24 years, 80% were employed and just over 50% were females.
In terms of interest in the product, over 70% of respondents indicated that they would be likely or very likely to use an app to schedule car maintenance. Consequently, the data suggests that there is a large potential market for the app among young employed professionals.
These were the insights that I gleaned from those interviews:
- The data suggests that there is a large potential market for the app among young employed females.
- The app could help to save users time and money when it comes to car maintenance.
- The app would be especially useful for people who lead busy lives.
- The app could potentially help to reduce the number of cars that end up in the mechanic’s shop.
Customer Experience Map
In order to extend our flow and define all pain points during the car maintenance process, I needed to map out the customer journey to help us discover more detailed interactions and highlight the full picture of the process. By doing this, we optimize the flow and create a better user experience.
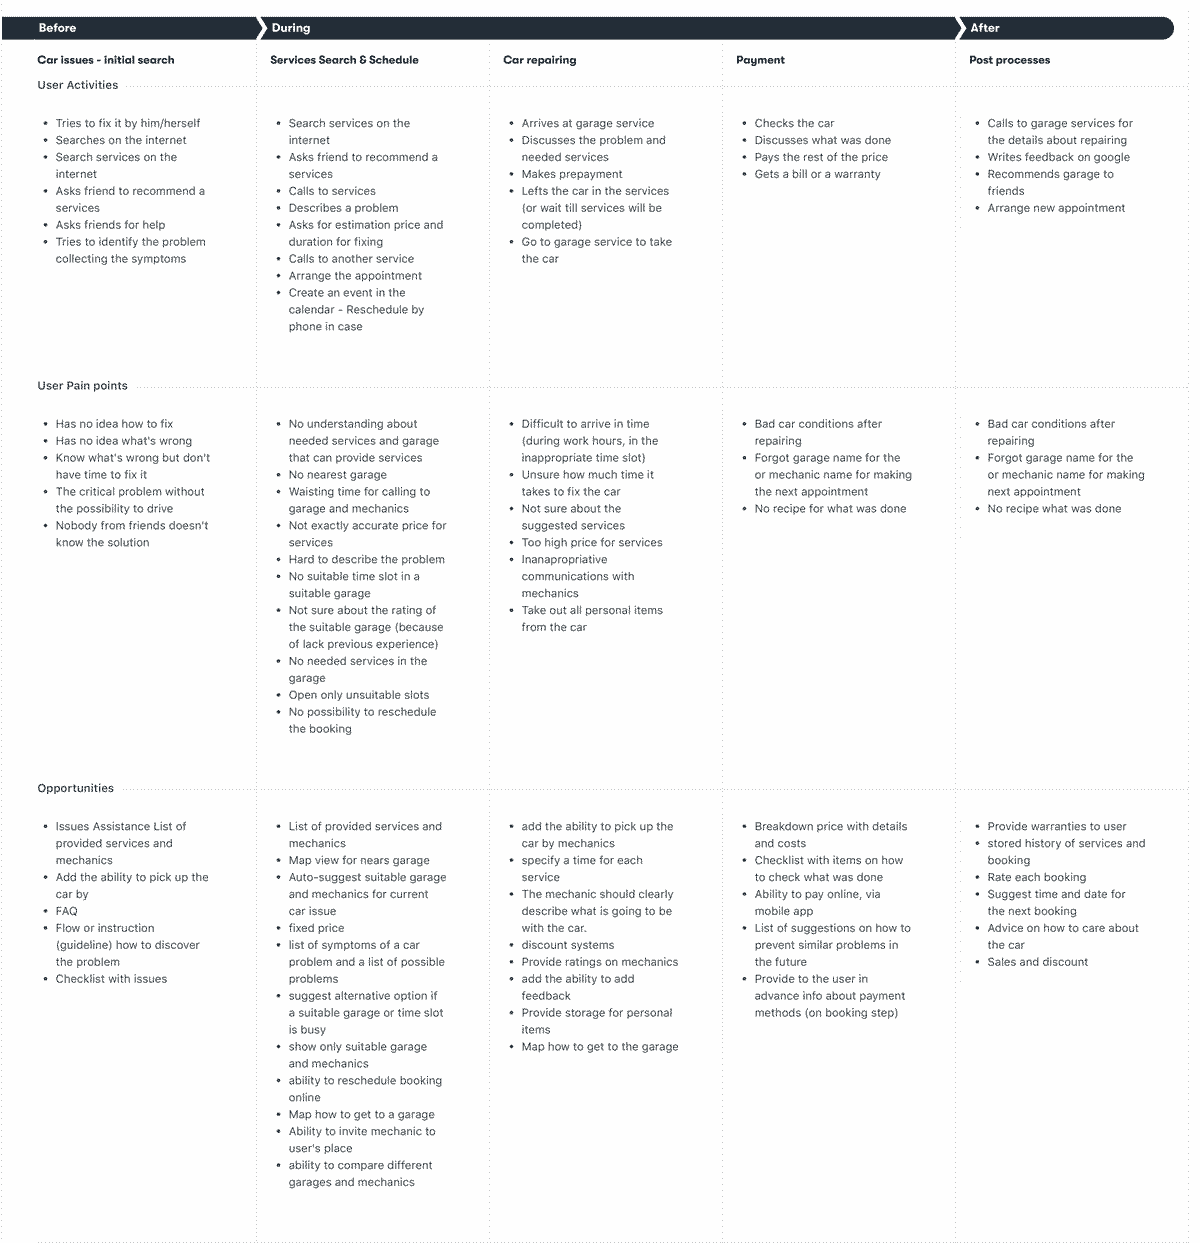
There are many participants in the car maintenance process, not just end-users. Workshop owners and mechanics are also involved. In my research, I focused on end-users, but there is potential for further study of the other participants.
End-users, of course, are interested in getting their cars serviced in a timely and affordable manner. There is much potential for further research into all aspects of the car maintenance process to improve the experience for everyone involved.
Here is the list of the main problems and possible solutions.
Problems
Solution
No understanding of car troubles
Issues assistance, list of symptoms of a car problem and list with possible problems
Wasting time to find garage and mechanic that fit user
Map view for nearest garages
No suitable time slot in suitable garage
Suggest alternative option if a suitable garage or time slot is busy
Not exactly accurate price and time duration for services
Unsure how much time it takes to fix the car, specify a time for each service
DESIGN
DESIGN
DESIGN
DESIGN
DESIGN

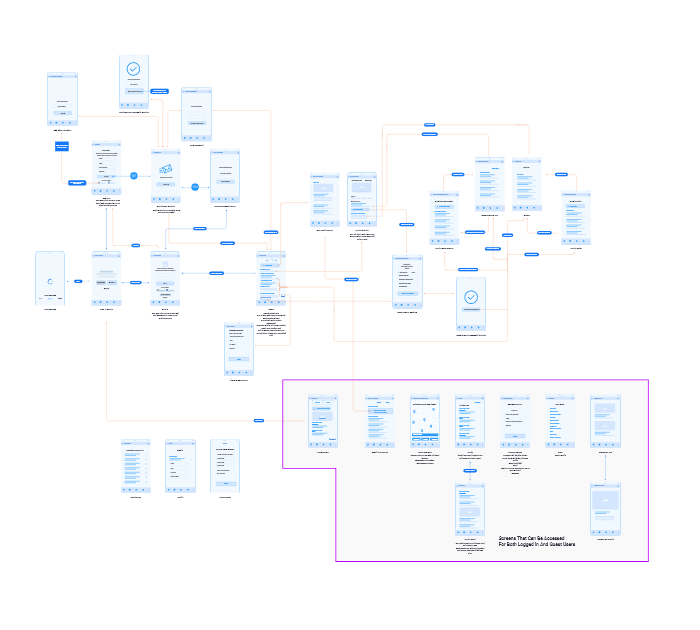
User flows
In order to ensure that our car maintenance application would be user-friendly, we decided to construct a user flow diagram. This process allowed us to map out the various steps that a user would take in order to complete a task, such as scheduling an appointment or viewing their account history.
Additionally, the user flow diagram helped us to identify potential areas of confusion or ambiguity. By anticipating these issues early on, we were able to make necessary changes to the design of our application helping us to create a smooth and efficient user experience.
Prototyping
I created a low-fidelity Figma prototype for usability testing. To go along with it, I produced a test plan document that outlined the goals, methodologies (remote moderated sessions), and tasks for the users to accomplish.
The goal of the test was to get feedback on the design of the interface and overall user experience. The tasks were meant to represent common scenarios that users would encounter when using the app.
I recruited eight participants and conducted the tests over a two-week period. The results indicated that the design was mostly successful, but there were some areas that needed improvement. Based on these findings, I made several changes to the prototype and released an updated version for additional testing.
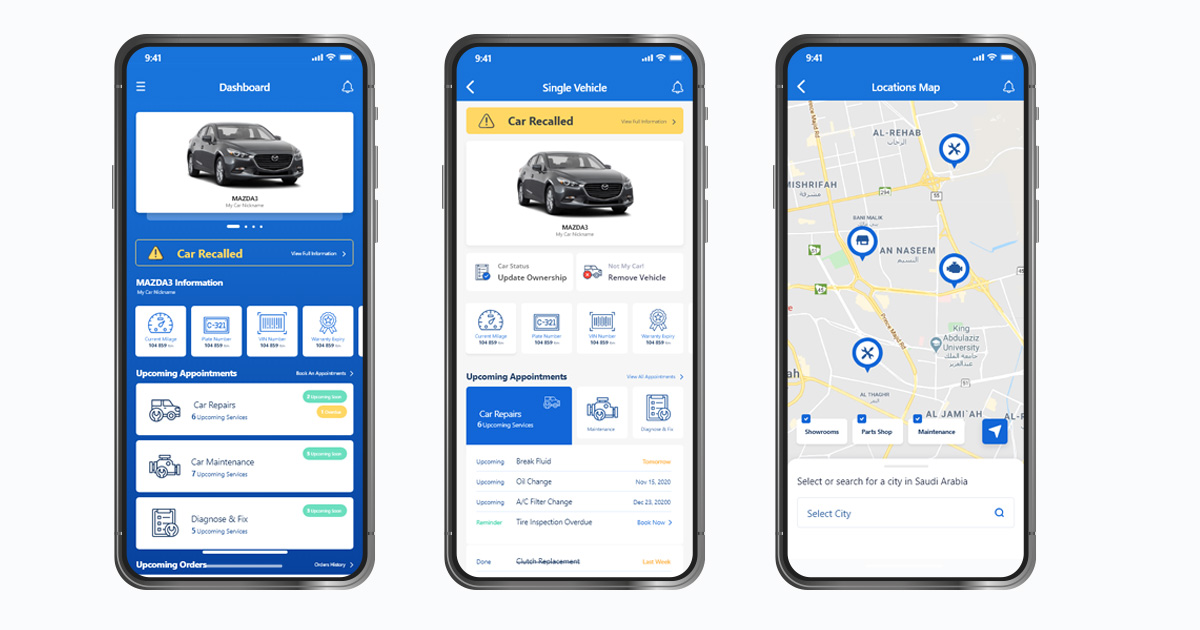
After conducting my research, I proceeded to a few high-fidelity designs before handing over the wireframes to the UI designer.
TESTING
TESTING
TESTING
TESTING
TESTING

Usability testing
The usability tests were carried out to evaluate the usability of the car maintenance mobile app for novice users of the application. The tests aim to:
- Give insights into how first-time users interact with the app
- Understand how intuitive and user-friendly the app is and identify potential areas of improvement.
- Determine the impact of the current user interface on the users’ perceived usability of the mobile app.
- Identify problems that users encounter when interacting with the mobile app.
The results showed that most users found the app easy to use and navigate. However, some users struggled with the functionality of the app and found it hard to use some of the features. Overall, the usability tests were successful in identifying areas where the app could be improved to make it more user-friendly.
Test Participants
Thirteen (13) participants were recruited for the user tests. The recruitment criteria were:
- Visited an auto repair and maintenance business in the last six months
- Have access to an internet-enabled phone or device.
Test Process
The test was conducted remotely and under moderated conditions. The participants were given a task list and were instructed to use the “Think Aloud” protocol, which required them to narrate their actions while interacting with the application.
They were also supposed to notify the moderator when they believed they had completed a task or when they were unable to complete a task.
Figma Mirror was used to access the program, while Lookback was used to administer the test. The test sessions were saved to the Lookback service for cloud storage.
After the test sessions, video reviews were conducted to monitor and assess testers’ verbal descriptions, crucial incidences, and actions and facial expressions during the test sessions. This enabled a more in-depth examination of the user experience and how testers interacted with the app.
The moderator was able to chat with the participants face to face while they did various tasks since the testers’ phone cameras were turned on during the sessions. The collected information was examined by comparing task completion rates and task completion times.
Test Process
Questionnaires were administered pre-test and post-test to users who agreed to participate in the study. The study sought to determine the demographic characteristics of the participants as well as assess their perceptions of the repair and maintenance app.
Ages ranged from 18-65 years old, with a median age of 25. There were more male participants (60%) than females (40%). The vast majority of participants were employed (94%) and had a college degree (78%).
The pre-test questionnaire was sent using Google Forms, while the post-test assessment questionnaire for the SUS (System Usability Scale) was distributed via SurveyMonkey.
A debriefing interview was held to allow testers to share their experiences and perceptions of the application in an open-ended manner. The following are the questions from the debriefing interview:
- How did the user testing go?
- How would you describe the prototype’s overall aesthetic appeal?
- What changes may be made to the prototype?
- What is the one thing you would prefer to maintain while changing everything else?
Objective
Scenario-Task
End State
Task 1
The splash screen should guide users to create account
You are a new user, how do you register a new account?
The user is directed to the homepage
Task 2
Users should be able to create a new repair order
You are in the homepage, how do you add a new repair task?
The user clicks the create a repair order button and begins exploring the page
Task 3
Users should be able to create a sale order
You are in the homepage, how do you create a sale order?
The user clicks the parts buy button and begins exploring the page
Task 4
User should be able to book a new appointment
You in the homepage, how do you book a new appointment?
The user clicks the booking button and begins exploring the page
Test results
The test participants were able to complete all the key tasks assigned to them within the allotted time. The average task completion time in seconds for each task is as follows:
- 98 seconds for task 1
- 115 seconds for task 2
- 102 seconds for task 3
- 75 seconds for task 4
Each tester was also given a SUS survey to evaluate the usability of the application. The results of the SUS responses can be seen below.
- The average score across all testers was 89.6, which indicates that the participants found the application easy to use.
- There were no major issues reported during testing and all testers were able to complete all tasks successfully.
- Overall, the testing process was successful and the application is ready for launch.
Based on the resulting SUS score above, the testers gave the application an overall rating of good for the usability test study. During the debrief interview, the testers were generally impressed with the process of doing all the key tasks.
The instructions were easy to follow and they didn’t encounter any major problems. There were a few suggestions for improvement, such as adding more items in the help section or redesigning some of the screens, but overall the testers were satisfied with the application.
The usability tests and debriefing interviews showed that the application serves its overall objective and that most of its key tasks can be accomplished as is.
Iterations
After completing the usability testing, I iterated based on the feedback I received from the study. The study was extremely helpful, as it gave me some great ideas for improvements that I otherwise would not have thought of. Based on the findings of the study, I implemented the following changes:
- Based on the recommendations, redesign and enhance the UI of the app.
- Consider enhancing the app by adding new recommended missing functionality, such as the ability to set up popular services.
- Perform further usability tests after adding new features and altering the apps based on the results of the final usability testing.
- Recruit new test subjects while simultaneously involving previous test participants.
These changes have greatly improved the user experience, and I am confident that they will be well-received by users. I will continue to iterate and refine my user flows based on feedback in order to ensure that they are as effective as possible.